Atenção: Em breve a versão em Português
www.roboforex.pt
Japanese Candlesticks Analysis 10.04.2012 (EUR/USD, USD/JPY)
10.04.2012 / 11:05
Analysis for April 10th, 2012
EUR/USD
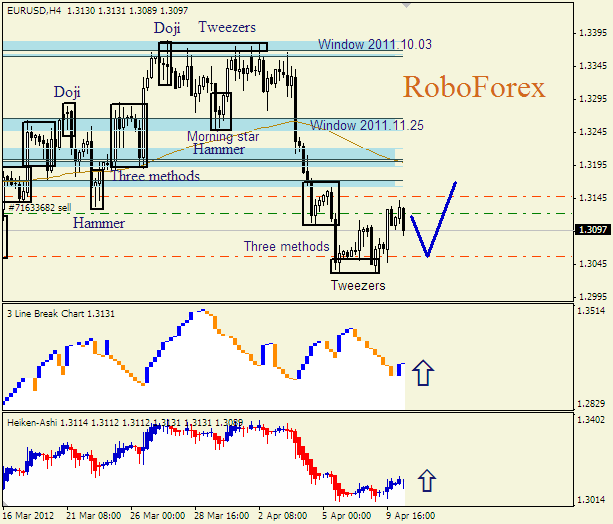
The H4 chart of the EUR/USD currency pair shows a bullish correction on the descending trend. Bearish Tweezers pattern indicates the start of the correction. Three Line Break and Heiken Ashi candlestick charts confirm an ascending correction.
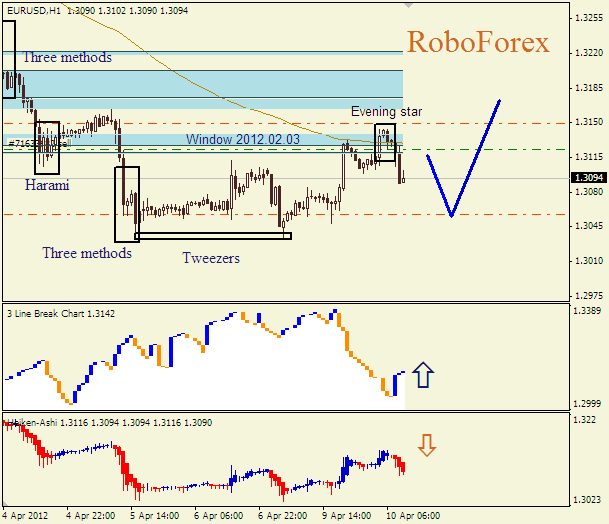
The H1 chart of the EUR/USD currency pair shows a sideways correction on the descending trend, which was started after bullish Tweezers pattern. Window 2012.02.03 is a resistance level, the price formed Evening Start pattern here. Three Line Break chart confirms a corrective mood, Heiken Ashi candlesticks indicate a bearish pullback.

USD/JPY
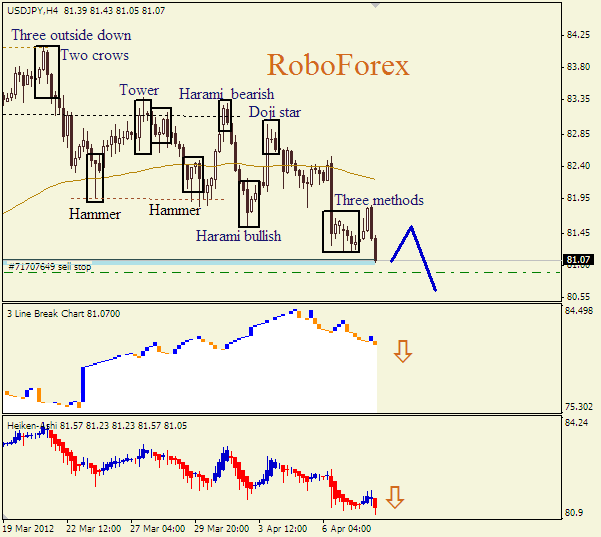
The H4 chart of the USD/JPY currency pair shows a correction on the ascending trend, which is indicated by bearish Two Crows and Three Outside Down patterns. Three Methods continuation pattern indicates that the bearish trend continues, Window 2012.02.24 is a support level. Three Line Break and Heiken‑Ashi candlestick charts confirm a descending tendency.
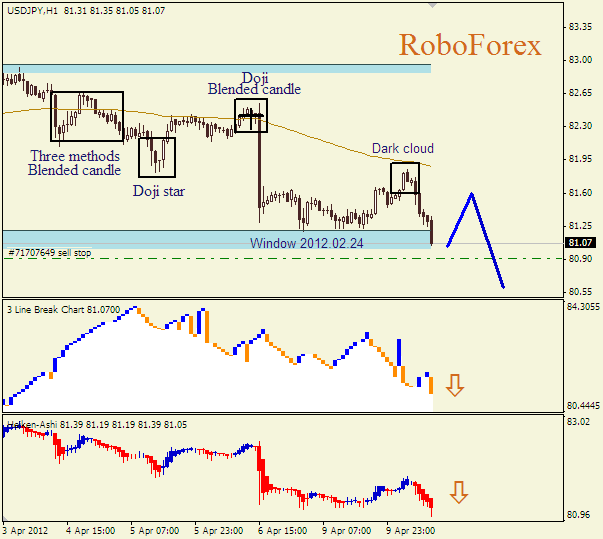
The H1 chart of the USD/JPY currency pair shows a bearish tendency on the descending trend, which continued after Dark Cloud pattern. Window 2012.02.24 is a support level. Three Line Break and Heiken Ashi candlestick charts confirm a descending trend.


Sem comentários:
Enviar um comentário