
Agora você pode acessar a sua corretora através dos domínios www.roboforex.com.pt; www.roboforex.pt
Japanese Candlesticks Analysis 07.05.2012 (EUR/USD, USD/JPY)
07.05.2012 / 10:04
Analysis for May 7th, 2012
EUR/USD
The H4 chart of the EUR/USD currency pair shows a bearish tendency on the descending trend, which started after Engulfing Bearish pattern. A new Window is a resistance level. Three Line Break and Heiken Ashi candlestick charts confirm a descending movement.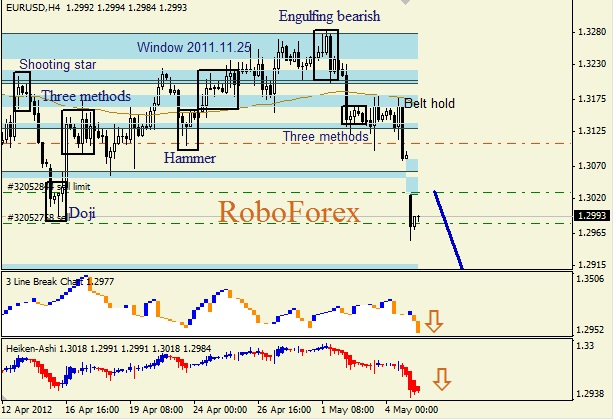
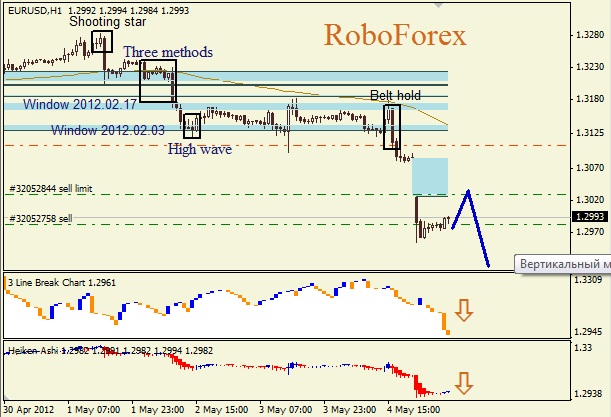
The H1 chart of the EUR/USD currency pair shows a correction on the descending trend. A new Window is a resistance level. Three Line Break and Heiken Ashi candlestick charts confirm a descending movement.
USD/JPY
The H4 chart of the USD/JPY currency pair shows a bullish correction on the descending trend, which was started after Belt Hold and Tweezers patterns. Three Line Break chart confirms an ascending movement, Heiken‑Ashi candlesticks indicate a descending trend.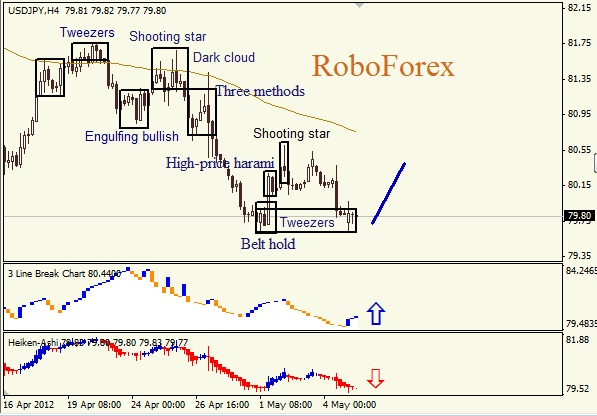
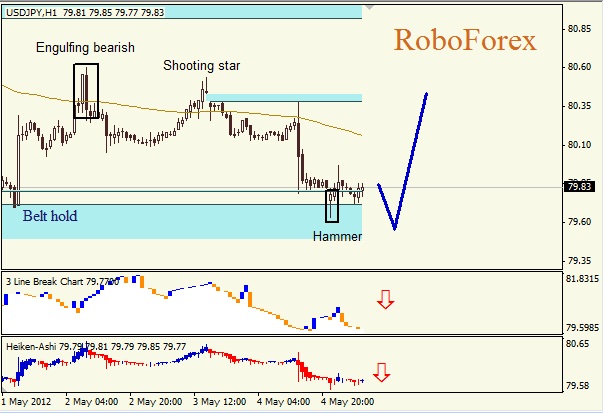
The H1 chart of the USD/JPY currency pair shows a bullish correction on the descending trend, which is indicated by Hammer pattern. Window is a support level. Three Line Break and Heiken Ashi candlestick charts indicate a descending trend.
Sem comentários:
Enviar um comentário