
Japanese Candlesticks Analysis 05.06.2012 (EUR/USD, USD/JPY)
05.06.2012 / 14:41
Analysis for June 5th, 2012
EUR/USD
The H4 chart of the EUR/USD currency pair shows the correction on the descending trend, which is indicated by Hammer and Engulfing Bullish patterns. Window is a resistance level. Three Line Break and Heiken Ashi candlestick charts confirm an ascending movement.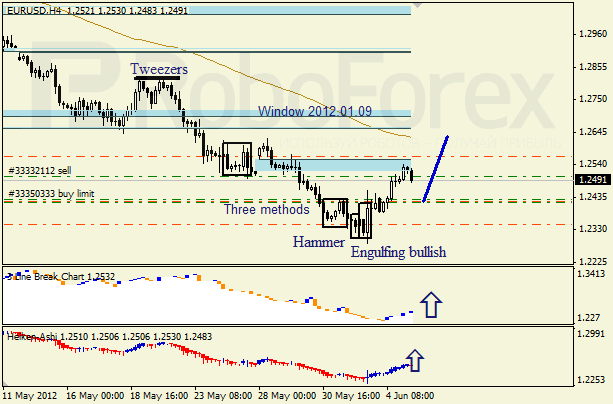
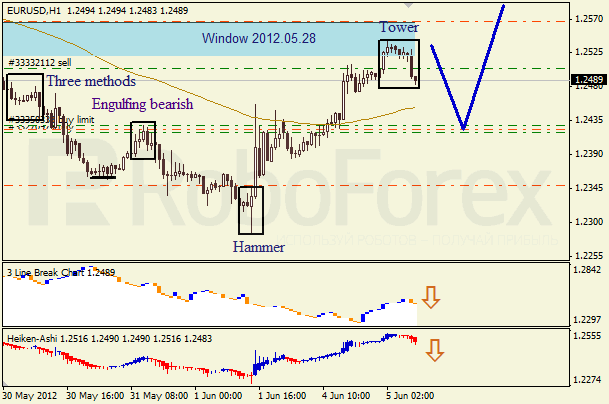
The H1 chart of the EUR/USD currency pair shows the correction on the ascending trend, which was started after Tower pattern. Three Line Break and Heiken Ashi candlestick charts confirm the bearish correction.
USD/JPY
The H4 chart of the USD/JPY currency pair shows the correction on the descending trend. Window 2011.12.26 is a support level, the price is forming Engulfing Bearish pattern. High Wave pattern and Three Line Break chart confirm the correction, Heiken‑Ashi candlesticks indicate a bearish pullback.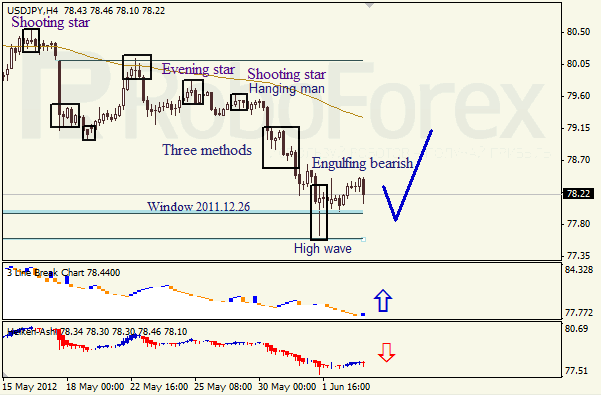
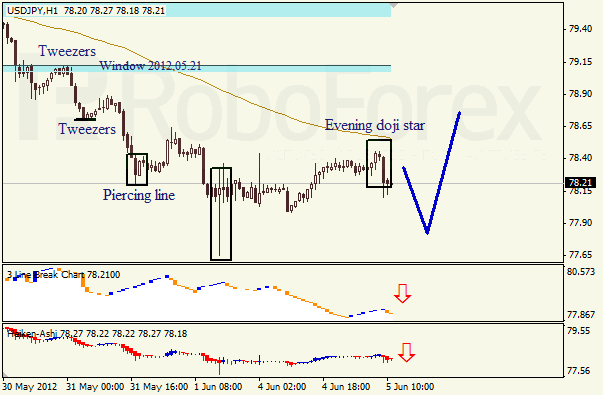
The H1 chart of the USD/JPY currency pair shows the correction on the descending trend, which is indicated by High Wave pattern. Window 2012.05.21 is a resistance level. Evening Doji Star pattern, Three Line Break and Heiken Ashi candlestick charts confirm a bearish pullback.
Sem comentários:
Enviar um comentário