Japanese Candlesticks Analysis 02.07.2012 (EUR/USD, USD/JPY)
02.07.2012 / 11:23
Abra Sua Conta de Negociação hoje mesmo e conheças as vantagens da RoboForex LP
Analysis for July 2nd, 2012
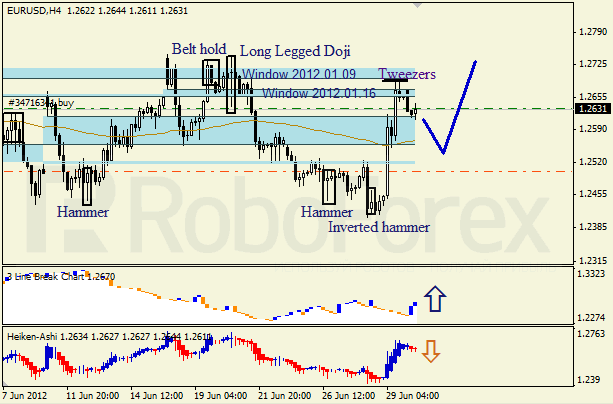
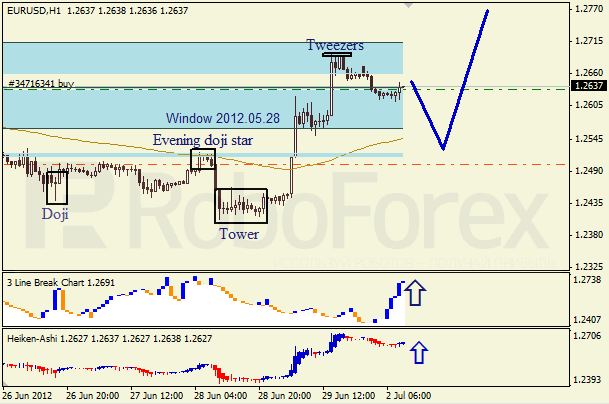
EUR/USD
The H4 chart of the EUR/USD currency pair shows an ascending tendency on the sideways trend. Window, which is the closest to the price, is a resistance level. Tweezers pattern and Heiken Ashi candlesticks indicate a bearish pullback, Three Line Break chart confirms an ascending movement.
The H1 chart of the EUR/USD currency pair shows a bearish tendency on the ascending trend, which started after Tweezers pattern. Window, which is the closest to the price, is a resistance level. Three Line Break and Heiken Ashi candlestick charts confirm an ascending movement.

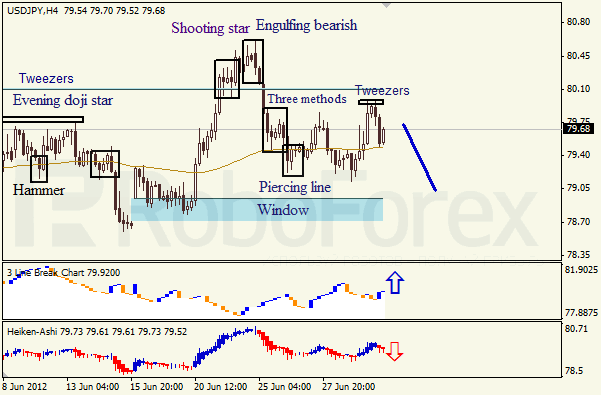
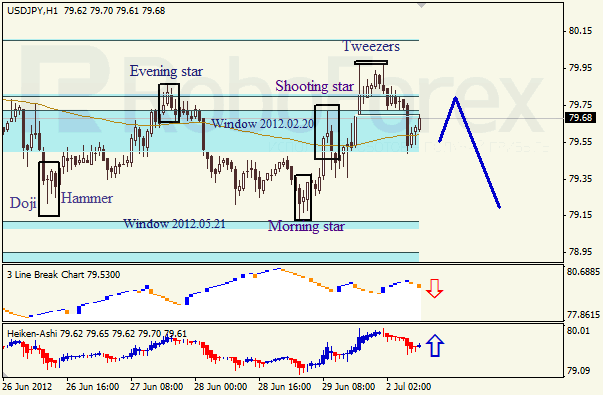
USD/JPY
The H4 chart of the USD/JPY currency pair shows a bearish tendency on the sideways trend, which continued after Tweezers pattern. Three Line Break chart indicates an ascending movement, Heiken‑Ashi candlesticks confirm a bearish mood.
The H1 chart of the USD/JPY currency pair shows a bearish tendency on the sideways trend, which started after Tweezers pattern. Three Line Break chart confirms a descending movement, Heiken Ashi candlesticks indicate a bullish pullback.

RoboForex, Nova Zelândia
Endereço: Level 10, 21 Queen Street, Auckland, 1010, New Zealand
Tel:
E-mail: info@roboforex.com
E-mail affiliate: sales@roboforex.com

Sem comentários:
Enviar um comentário